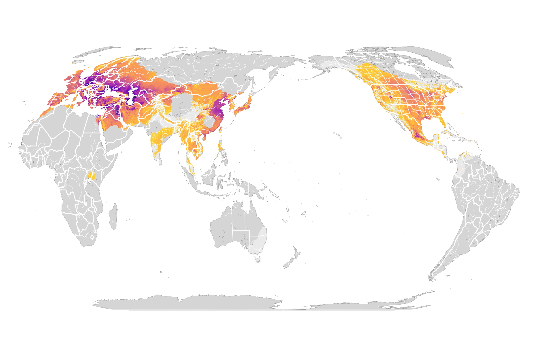
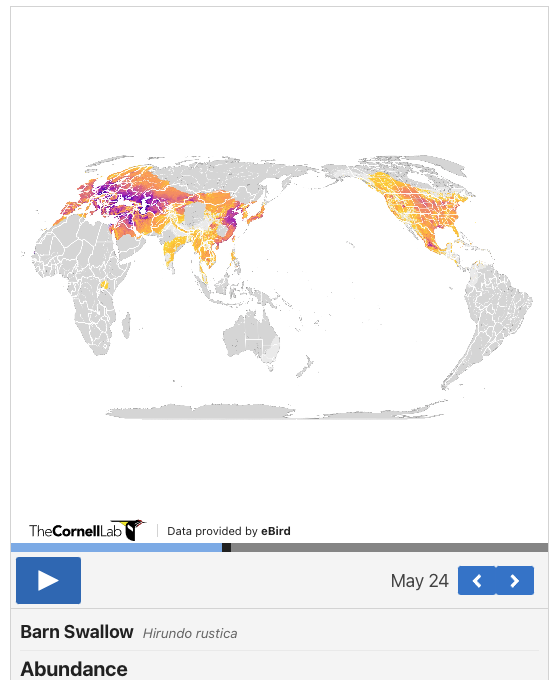
Barn Swallow abundance map
The power of Birds of the World lies in its ability to synthesize data, science, multimedia, and maps from a variety of sources to reveal the most complete and accurate picture of birdlife possible. A growing network of contributors, scientists, and editors are constantly working behind the scenes to expand and integrate this knowledge into Birds of the World.
Thanks to new and improved modeling methodology and the expanding global network of eBirders, the eBird Status & Trends project modeled 1,009 species across their entire global range for the first time. Nearly 700 of these updated and expanded maps (the ‘best of the best’) were incorporated into Birds of the World, and thousands more species are expected to be modelled next year.
Check out the BOW Barn Swallow account to see a global picture of this species’ relative abundance through the seasons.
How are maps like this possible? In the last year alone, nearly 400,000 eBirders from around the world contributed bird observation data – from 11 million unique locations – on 36.1 million checklists. When combined and analyzed, these data can be transformed into a powerful tools for research, conservation, and education. For example, the eBird Science team uses state-of-the-art statistical models and machine learning to build visualizations and tools to help decision makers, scientists, and birders better understand migration, abundance patterns, range boundaries, and much more. The team compiles the raw eBird data (the when and where people report birds) and high-resolution satellite imagery from NASA (National Aeronautics and Space Administration), NOAA (National Oceanic and Atmospheric Administration) and USGS (United States Geological Survey) into cutting-edge statistical models to predict when, where, and in what numbers species occur every week of the year. These maps are then reviewed by scientists before inclusion on our platforms.
Look for more and more of these global distribution and abundance maps to appear in Birds of the World.
Learn more about this new release and see how more than 6,000 eBirders in places from Spain to China allowed the team to model the expected relative abundance of Blue Rock-Thrush.

Partnerships
A global alliance of nature organizations working to document the natural history of all bird species at an unprecedented scale.