Species names in all available languages
| Language | Common name |
|---|---|
| Catalan | cardenal vermell |
| Czech | kardinál červený |
| Dutch | Rode Kardinaal |
| English | Northern Cardinal |
| English (United States) | Northern Cardinal |
| French | Cardinal rouge |
| French (France) | Cardinal rouge |
| German | Rotkardinal |
| Hebrew | קרדינל צפוני |
| Icelandic | Kardínáli |
| Japanese | ショウジョウコウカンチョウ |
| Norwegian | rødkardinal |
| Polish | kardynał szkarłatny |
| Russian | Красный кардинал |
| Serbian | Crveni kardinal |
| Slovak | kardinál červený |
| Slovenian | Severni kardinal |
| Spanish | Cardenal Norteño |
| Spanish (Honduras) | Cardenal Rojo |
| Spanish (Mexico) | Cardenal Rojo |
| Spanish (Spain) | Cardenal norteño |
| Swedish | röd kardinal |
| Turkish | Kırmızı Kardinal |
| Ukrainian | Кардинал червоний |
Revision Notes
Peter Pyle contributed to the sections on Similar Species, Plumages, Molts, and Bare Parts on the the Appearance page.
Cardinalis cardinalis (Linnaeus, 1758)
Definitions
- CARDINALIS
- cardinalis
The Key to Scientific Names
Legend Overview
Northern Cardinal Cardinalis cardinalis Scientific name definitions
Version: 2.0 — Published February 12, 2021
Account navigation Account navigation
Figures from this Account
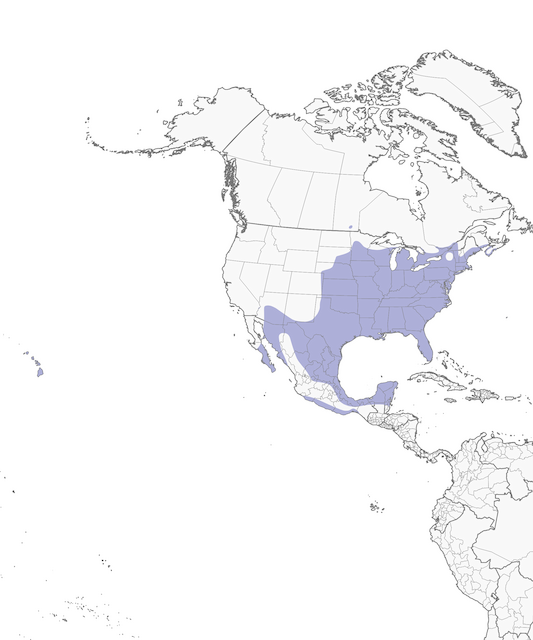
Distribution of the Northern Cardinal
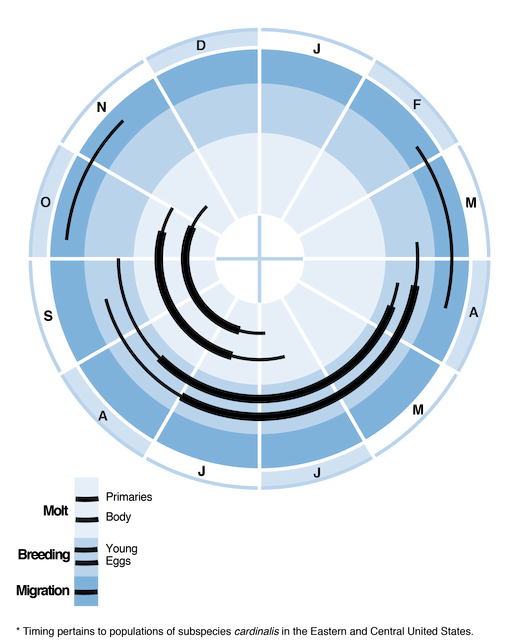
Figure 1. Annual cycle of breeding, migration, and dispersal of Northern Cardinal.
"Molt" refers to Definitive Prebasic Molt. Dispersal timing based upon Ohio data (S. P. Baldwin and M. B. Trautman in Hundley 1953). Breeding based on Tennessee data (Laskey 1944). "Young" ring shows period from hatching through fledging. "Migration" ring is here being used to show dispersal. See Dow and Scott (1971) for times of dispersal movements in other areas. Thick lines show peak activity; thin lines, off-peak.
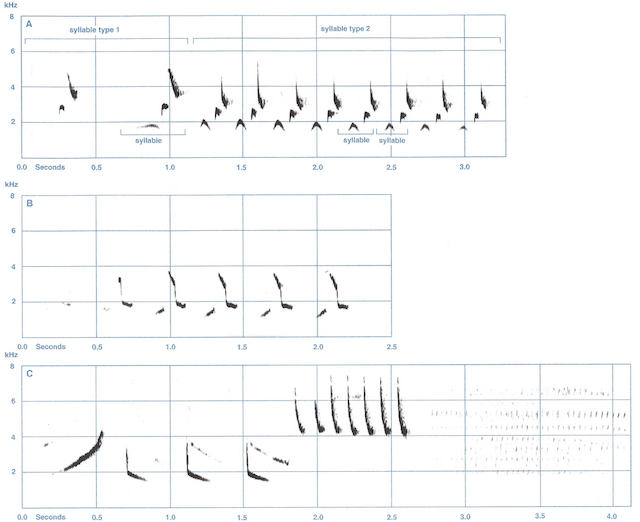
Figure 2. Three different song types of Northern Cardinal.
A. Made of up of 2 types of syllables. B. Made up of 1 type of syllable. C. Made up of 4 types of syllables, the last of which is a chirr. The first 2 song types, or variants of them, are common over much of the cardinal’s range, as are songs made up of the first 2 syllable types of the third song. The durations of songs shown here are typical, but occasional songs consist of only a single syllable, and songs of 20 s or longer are also occasionally sung (SLH). (Part A recorded from male; B and C from females singing from their nests.) Part A shows terminology used to describe songs. Syllables are consistently repeated short sounds or ordered sets of 2–3 short sounds. The syllables sung by an individual or local population of cardinals can be sorted into discontinuous sets of syllable types, defined on the basis of close similarity in sonogram shape (pattern and timing of frequency modulation). A song type is defined by the order and identity of its syllable types. Sonograms prepared by staff of Borror Laboratory of Bioacoustics (BLB), Ohio State University, using a Kay Elemetrics DSP 5500 Sona-Graph with effective bandwidth of 150 Hz (200 pt. transform size), from recordings made by SLH, Rice County, Minnesota, 22 June 1990 (A), 23 July 1990 (B), and 21 June 1990 (C).
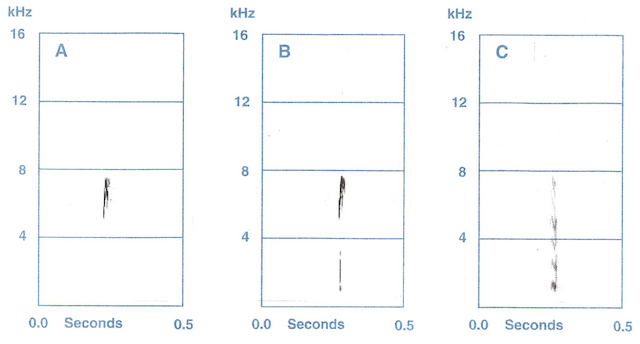
Figure 3. Calls of Northern Cardinal.
A. Chip call by male. B. Chip call by female approaching her nest. C. Took call by female at nest. Note that the frequency scale (vertical axis) differs from that of Figure 2. Sonograms prepared by staff of BLB (chips), and by SLH (took) using a Kay Elemetrics DSP 5500 Sona-Graph with effective band width of 300 Hz (200 pt. transform size), from BLB recording no. M205, Franklin County, Ohio, 30 July 1967 (A) and from recordings made by SLH, Rice County, Minnesota, 23 July 1990 (B) and 29 June 1990 (C).
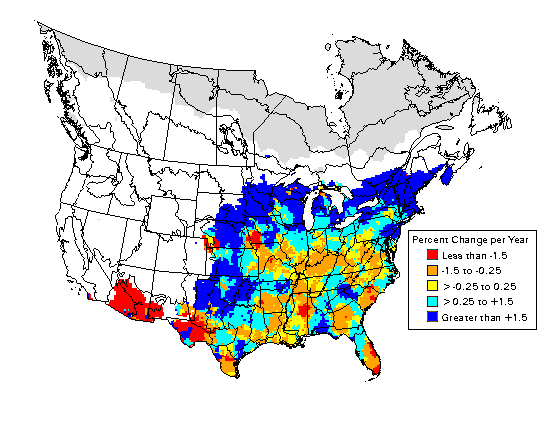
Figure 4. Regional trends in Northern Cardinal breeding populations.
Based on data from the North American Breeding Bird Survey, 1966–2015 (Sauer et al. 2017). Data show estimates of annual population change over the range of the survey; areas of increase are shown in blue and declines are shown in red. See Sauer et al. (2017) for details.